Introduction
The new coronavirus disease (COVID-19) is a virus that was first identified on January 13, 2020 as a result of research conducted in a group of patients who developed respiratory symptoms (fever, cough, shortness of breath) in Wuhan Province in late December. Since then it was characterized as a pandemic by the World Health Organization (WHO) in March 11, 2020.
Research Methodology
A. Study Area
The research is focused on the global situation of the pandemic and countries with more significant number of confirmed cases, deaths or recoveries are also analyzed seperately.
B. Data Sources
Daily coronavirus cases by countries: This dataset is provided by the the Johns Hopkins University Center for Systems Science and Engineering (JHU CSSE). It has three daily seperate data, confirmed cases, deaths and recoveries, for each country.
C. Analysis and Discussion
Data distribution
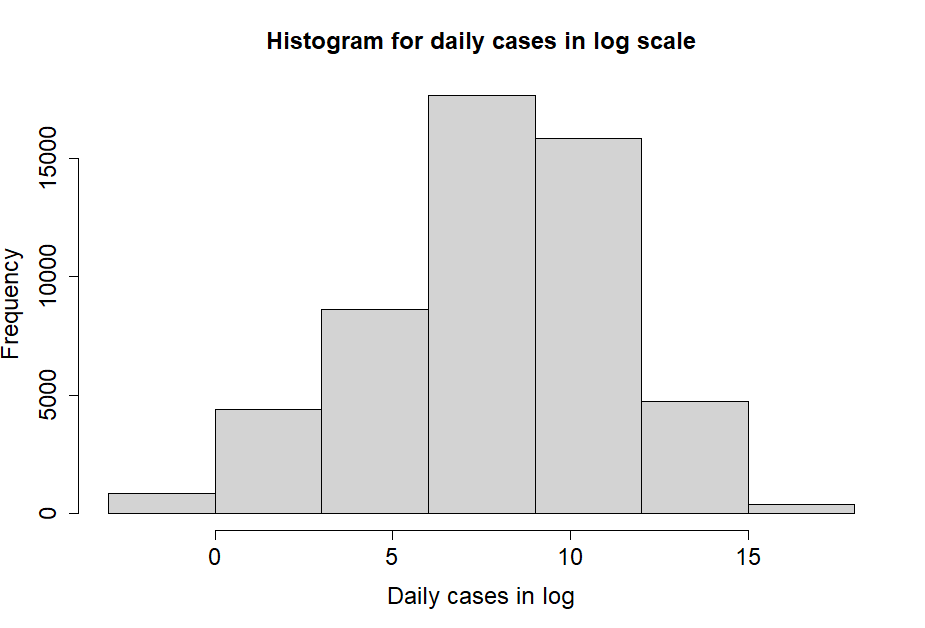
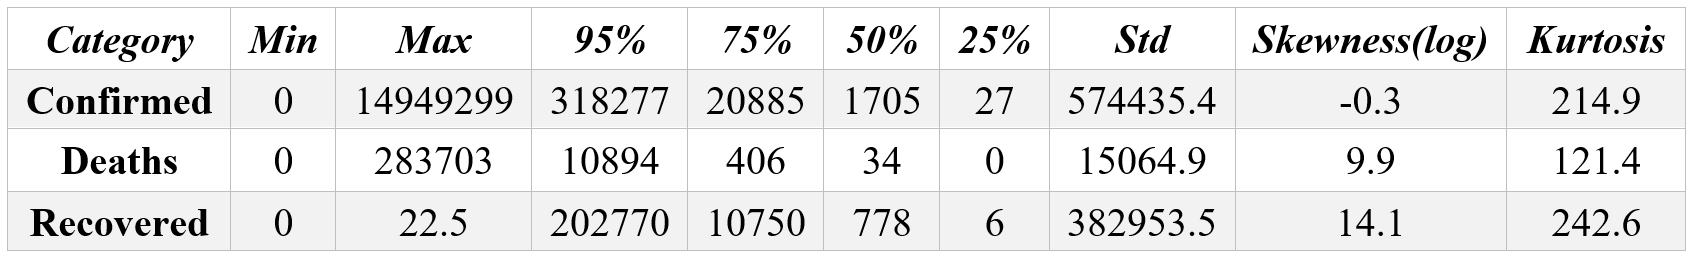
As we can see in Figure 1, for the number of daily cases we have a negatively skewed distribution for our data. We can confirm it by analyzing further by creating descriptive statistics of our data.
Europe confirmed cases
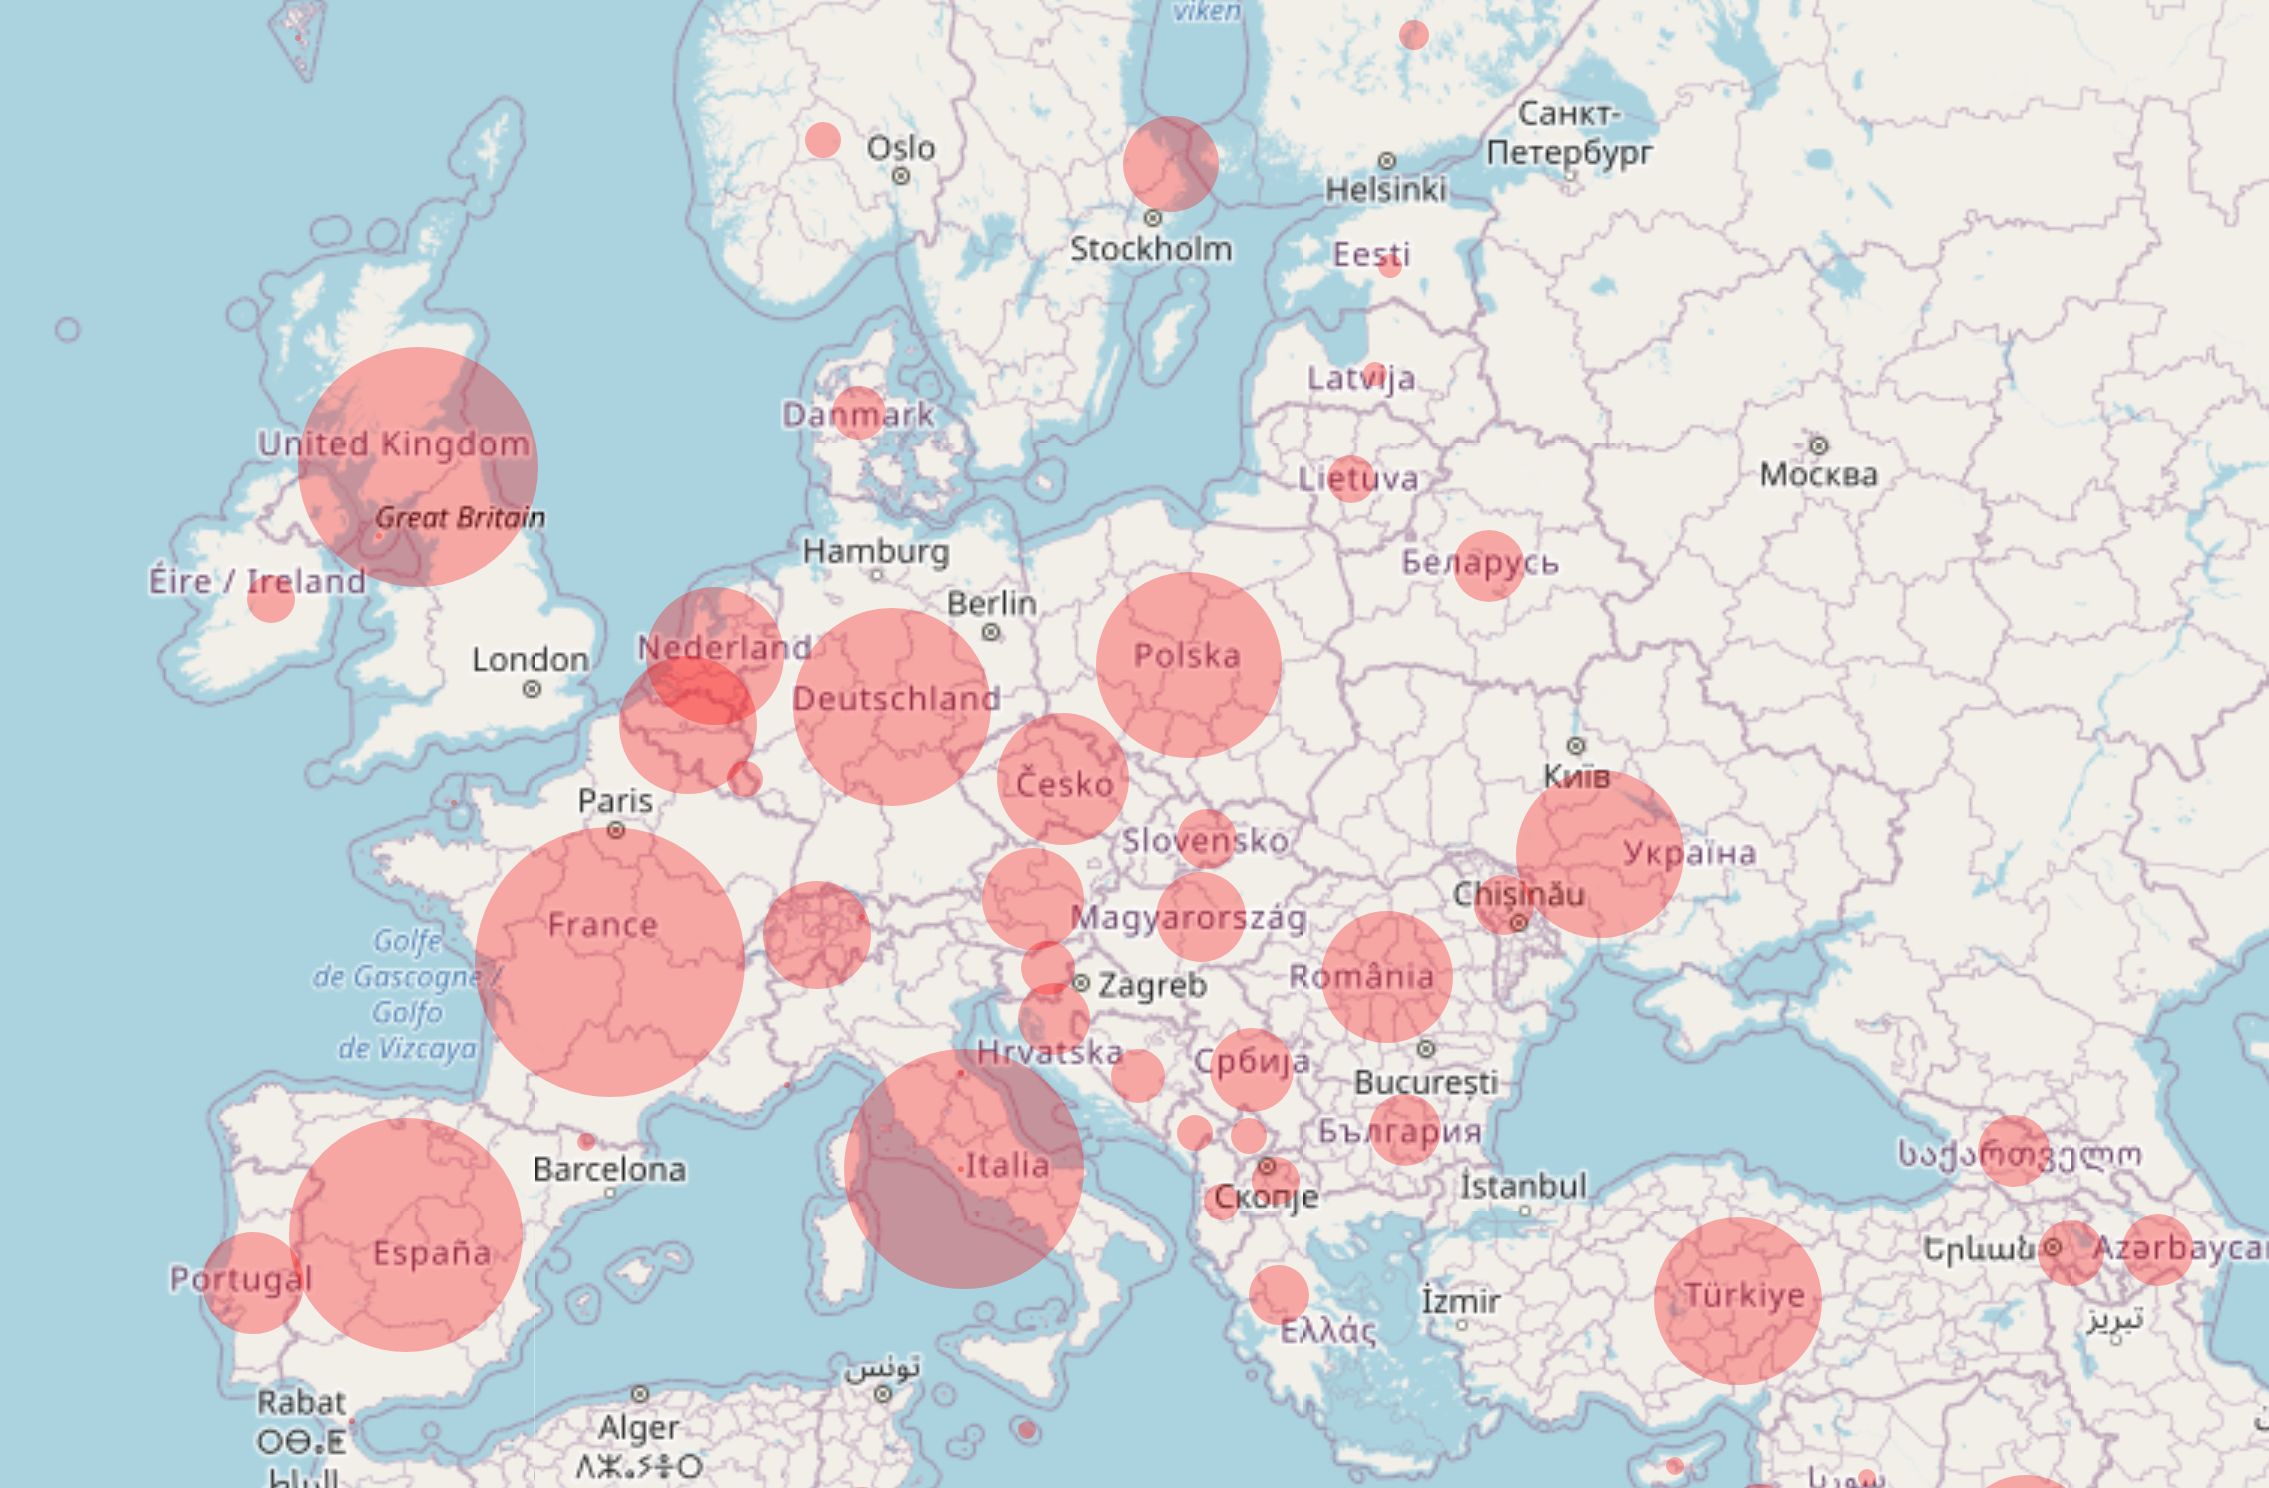
To have a better idea of how european countries are affected by the pandemic we can look Figure 3, which shows us the confirmed cases (bigger circles = more cases). France, UK, Italy and Spain seems to have the most cases in Europe.
10 countries with the highest confirmed cases
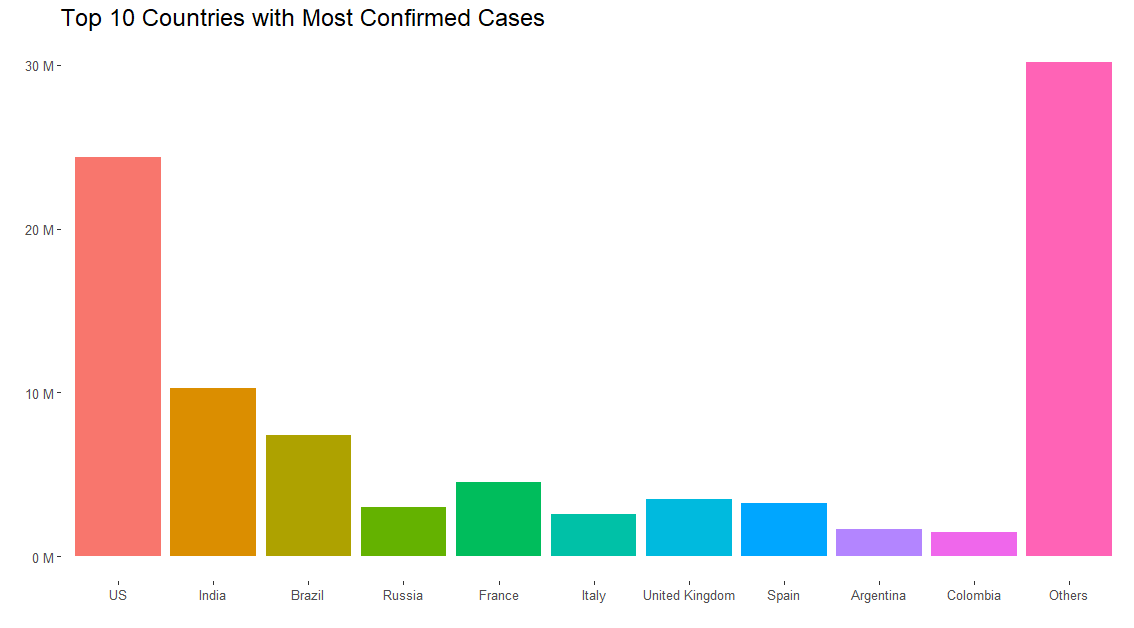
If we look at the countries with the most cases worldwide in Figure 4, US is leading (not in a good way) by far and should take more precautions to stop the spread. From the European countries as we saw on the map France, UK, Italy and Spain are the ones with the most cases.
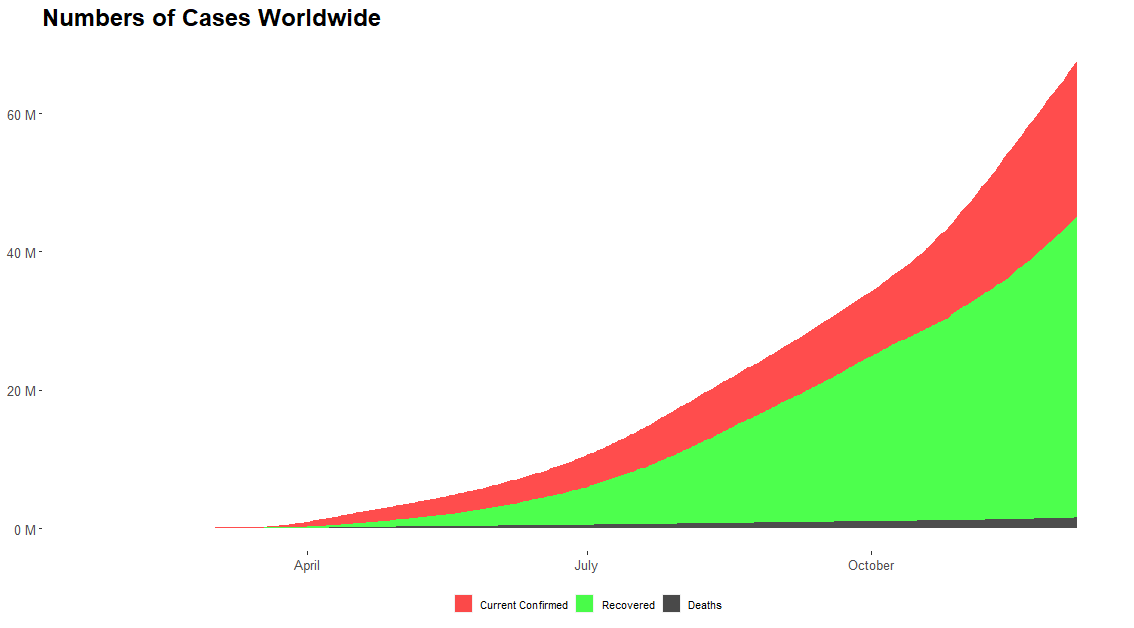
Cumulative number of cases, deaths and recoveries
In Figure 5 we see the total cases, deaths and recoveries worldwide and it is obvious that the cases have been increasing exponentially along with the recoveries even though death rates remained linear. The disrepancy between the case rates and death rates might be caused either by effective medical systems or low mortality rate of the virus.
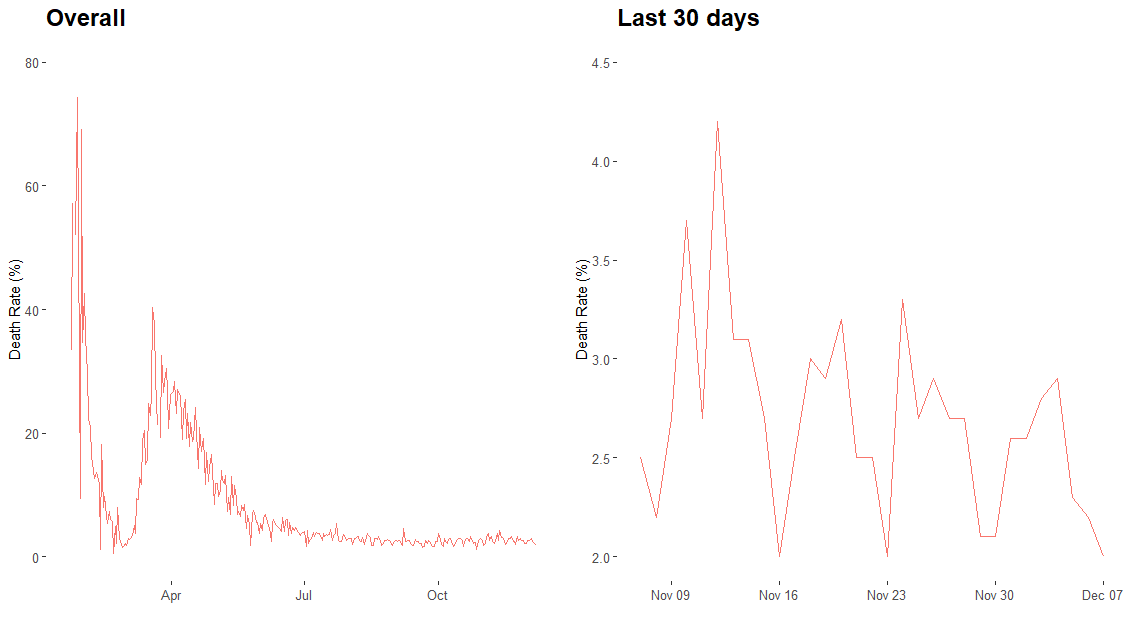
Overall death rate vs last 30 days
Death rates have peaked at the earlier stages of the pandemic but then decreased dramatically starting from April and it was very slowly decreasing in the last thirty days as well as we can see from figure 6.
Conclusion
In conclusion, in this study we have learned that the number of cases are increasing exponentially in the world and number of recoveries doesn’t seem to be able to catch up thus making it very important to slow down the spread. Especially some European countries and US are the countries with the most confirmed cases accounting for nearly 50% of the global cases. They need to take precautions immediately if their strategy is not fighting with the herd immunity. Recently, the countries started to vaccinate their citizens and further studies will be required to measure their global effect and to see if we can eliminate COVID-19 completely from the Earth.